Showing posts with label cycling. Show all posts

Monday, 12 August 2013

The road not taken

I recently changed the route of my cycle commute into central London, trading a longer journey (about five minutes more) for a cleaner, safer and less stressful one. The downside is it takes me half a mile and about five minutes more to get to work, but by going over Southwark instead of London Bridge the upside is I'm less likely to be crushed by a truck or get respiratory problems from the air around Bank.

Cyclists make these kinds of calculation all the time. They take quiet back streets to avoid dangerous main roads, they dismount and cross at pedestrian signals rather than try to turn right across moving traffic, and so on. There are a number of daredevils who take the most direct route to where they're going regardless of the conditions, but in my experience almost everyone who cycles accepts some kind of delay or diversion in exchange for extra safety, comfort or peace of mind.

But that's just the people who cycle, and in Britain they are relatively few in number. Most people don't cycle, presumably because they don't think it worth their while. On the face of it this is a puzzle, since cycling can be faster than driving or other modes of transport in many contexts. But the reality is that this speed advantage can be wiped out if you have to make too many of these delays and diversions to make the trip acceptable by bike. If people have to go around the houses to feel safe on a bike, many of them will just take the car instead.

The flip-side is that if we can make the quick and direct routes safe and comfortable to cycle, then many people will find that cycling suddenly makese sense for them. This is what happens in the Netherlands, where people are not expected to either brave unpleasant conditions on main roads or work out a convoluted but quiet route on back roads. By making cycling safer, they have made it quicker too, and that's the key.

Evidence on how far people will go out of their way to avoid unpleasant or dangerous roads has long been one of the missing pieces in understanding the choice of whether or not to cycle. If we knew how much time people would give up to avoid a bad junction, we can guess how much time we could save them by making it safe and pleasant to cycle through, and then estimate the impact on cycling's local mode share, traffic congestion and so on. These factors are key to the kind of economic analysis which determines how transport funding gets spent and which has so far more or less ignored cycling.

So this research into cyclists' route choices carried out for TfL by Steer Davies Gleave could be very important, because it tries to answer exactly these questions. They asked people (mostly people who cycle in London) to rate the attractiveness of different types of junction types and cycling conditions, and crucially it asks them how much time they would be willing to add to their journey to avoid particular situations.

Here are some of the results. First, the extent to which people agreed with various statements about route choice, by their frequency of cycling, age and gender.


The first thing to note is how many people, even frequent cyclists, agree with statements like "If I had to negotiate a number of difficult junctions I would try to find another route" and "I would prefer cycling in a cycle lane which is separate from the traffic even if it meant a longer journey". But the different average responses by gender are striking too: women seem significantly more likely to change their routes due to safety concerns than men, consistent with findings from the British Social Attitudes survey showing women are more likely to think the roads are too dangerous to cycle. Finally, long-term cyclists (those with more than two years experience) are consistently more willing to endure bad conditions in exchange for a quicker journey than inexperienced ones. There is probably a learning or hardening effect here, with people becoming more skilled or better able to cope with unpleasant conditions over time - but there is undoubtedly a selection effect too, with many people trying out cycling but not keeping it up due to safety issues. Experienced cyclists constitute the small minority of people who are willing and able to deal with the problems posed by cycling on British roads.

The researchers also asked people to rate how safe they felt cycling through different types of junctions.


Here, the striking thing is how unsafe people (mostly cyclists, bear in mind) think fairly common junction types are. The very first junction in my five-mile commute to work is a right turn from a side road onto a main road, and it's not very nice: I have to wait for a suitable gap in the streams of traffic and then dart into it at a decent speed. Clearly for many people this would be one junction too far and the journey as a whole would be unviable by bike.

The next charts illustrate how important this all is.


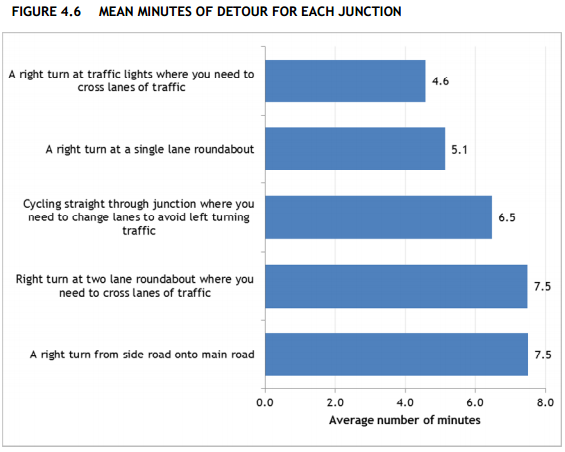
A majority of people said they were willing to accept a detour of over five minutes to avoid a right turn at a two-lane roundabout, or a right turn from a side road to a main road. The average was 7.5 minutes. These are very big figures, surprisingly big to me at first - but I'm an experienced, battle hardened cyclist, and as I said at the start I still make detours, though maybe not as big.

It's worth emphasising again that these kinds of results go a long way towards explaining why more people don't cycle in Britain. It's because our main roads are so dangerous and unpleasant to cycle on that people would rather sacrifice huge chunks of time than do so, to the extent that cycling is for most purposes no longer worthwhile.

Finally, the researchers asked people to compare different types of cycling facility. The chart below shows the average benefits people ascribed to each type of facility, with the most popular (off-road routes) set at 100.


The key result here is that there is a big preference for off-road cycling infrastructure as compared to bus lanes, advisory cycle lanes or mandatory cycle lanes, particularly among women. In comparison, the type of road doesn't seem to matter very much.

This certainly looks like a big win for segregated bike lanes (consistent with lots of other evidence on the subject), but it's worth bearing in mind that the picture of an 'off-road' route people were prompted with (below) looks more like a route through a park than a typical segregated track alongside a main road, and that has probably affected the results somewhat.

This is very valuable research because it starts to quantify the extent to which our current road designs fail people and prevent cycling from becoming a mainstream choice, and because it can also help us quantify the benefits of better infrastructure. It deserves to be read widely, by both campaigners and planners.

Monday, 29 July 2013

Quantifying the costs of road casualties in London, by borough and mode of transport

Injuries and deaths as a result of road collisions impose huge costs on our society, both on the people directly involved and an others more indirectly affected. While everyone will react differently to being in a road collision, we can try to quantify the average social and economic impacts in order to get at the overall cost to society as a whole and hopefully provide a further incentive for change.

The Department for Transport estimates the total cost of a road fatality to be around £1.7 million, of a serious casualty around £190,000, and of a slight casualty around £15,000. These are arrived at using the 'willingness to pay' economic method, and are meant to take into account the 'human costs' of suffering and grief, lost economic output due to injury or death and the costs of medical treatment.

Using these figures DfT estimates the total cost of reported road casualties in Britain in 2001 to be around £15.6 billion, and the total cost including unreported casualties to be up to around £34.8 billion.

Using the same average costs, Transport for London estimates the total cost of reported road casualties in London in 2011 to be around £2.35 billion. Since TfL also provide data on the location, mode and severity of each casualty in London in 2012, we can use the same figures to see how these costs vary from borough to borough and mode to mode.

The chart below shows the estimated total social and economic cost of reported road casualties in 2012 by borough and the casualty's mode of transport, using DfT's averages. There's a table with the same figures below the fold.


There are huge variations between boroughs in terms of both the scale and the composition of the costs associated with road casualties. The total cost in lowest in Kingston at around £27 million, and highest in Westminster at around £128 million. In Outer London boroughs car occupants account for a higher proportion of casualties and therefore of costs, while in some Inner London boroughs pedestrians and cyclists account for over half the costs, reaching 58% of the total in Westminster and 69% in the City of London. Across all boroughs the total costs by mode come to £523m for pedestrians, £345m for cyclists, £674m for car occupants and £518m for other modes (motorcycles, buses, taxis, goods vehicles, etc).

It's worth emphasising that these figures are bound to be an underestimate. Not only do they cover only reported casualties and excluse those that go unreported, but they arguably don't capture the full range of costs. Road danger results in 'avertive' behaviour, where people go out of their way to avoid particular danger-spots or choose to take modes of transport which are safer but slower or more expensive. These costs are very difficult to quantify and so they aren't included in the DfT figures.

Also, the average costs per casualty are likely to be higher in London than in other parts of the country, given the higher wages in London and therefore higher costs of lost output and higher 'willingness to pay' to avoid casualties.

It may sound callous to talk about road casualties in terms of money but this is really just a way to try and quantify the non-monetary costs in a rigorous way. And I think these figures could be a useful tool for campaigners too. Some boroughs don't seem to attach enough importance to road safety (or road danger reduction, if you prefer), but if the government were to levy fines on them in proportion to these costs I think it would concentrate minds pretty rapidly.

Monday, 1 July 2013

Trends in London cycling casualties

Last Friday Transport for London released statistics on London's recorded road casualties in 2012, along with (for the first time) some useful raw data - see under 'Data extracts' here. I've used the new figures to update some long-term trends in cycling casualties in London. Unfortunately they don't make for cheerful reading.

The first chart shows the trend in total recorded cycling casualties, split into slightly injured and killed or seriously injured ('KSI', in the rather inadequate jargon). As you can see, total casualties peaked in the early and late 1980s, fell fairly steadily in the early years of this century but rose again from about 2007, reaching just over 4,600 in 2012.


The large number of slight casualties hides the trend in fatl or serious casualties so the next chart isolates those. It show a slightly different trend, peaking in 1989 at almost 800 a year and with a sharp increase in the last few years to 671 in 2012.


These trends are pretty grim for cyclists, which as the chart below shows have comprised a seemingly ever-increasing share of London's fatal or serious road casualties over the last decade, reaching a fairly shocking 22% in 2012. Maybe instead of asking that cyclists get a share of investment equal to their mode share (around 2%) we should be demanding they get the same as their share of casualties?


Finally, let's have a look at cycling in the City of London, the tiny square mile at the heart of London which so many of us have to cycle through even if the people who run the place would rather we didn't. The first chart here shows a rising trend in total cycling casualties in the City since 1986.


And the second chart shows the trend in fatal or serious cycling casualties.


It should be fairly clear that the City has a big problem with cycling safety. Bear in mind that its Local Implementation Plan sets a target to reduce the number of fatal or serious casualties (of any type) to a yearly average of 39 by 2013 (4.54 here). But instead the trend is going in the opposite direction, with 49 killed or seriously injured in 2011 and 58 in 2012. As the chart above shows, cycling accounts for much of this increase, so maybe the City needs to radically change its approach to cycling provision if it's to have any chance of meeting its own targets.

One of the questions people reasonably ask when they see these kind of trends is whether casualties are rising faster than the number of people cycling, which we know has grown a lot in recent years. TfL point out that cycling on London's main road network has increased by 60% since 2005/06, but that overstates the growth in cycling trips around London as a whole, which as of 2011 had increased by only around 16% over the 2005-09 average compared to a 36% increase in fatal or serious casualties (compare table 3.5 here and table 2 here). So it's safe to say that the cycling casualty rate has worsened over the last few years, even if it's better than it was in the 1980s.

Sunday, 12 May 2013

History and cycling's mode share in Amsterdam and London

This presentation by René Meijer of the City of Amsterdam has a useful chart showing the transport mode split in Amsterdam by the length of the journey.

I've tried to recreate it for London, using data from the London Travel Demand Survey downloaded from TfL's Romulus website*. It's not possible to make an exact comparison, for a few reasons:
  • For London I use data on journey 'stages', which includes things like walking to the bus stop. It's not clear whether the Amsterdam data uses data on stages or on the main mode used for a trip from A to B.
  • The journey distance categories are slightly different between the two cities.
  • I've included motorcycle journeys in the 'car' category in London, but it's not clear whether or how they are counted in Amsterdam.
With those caveats in mind, here's the London chart.
Note, I've tried to use similar colours, so the reason there's lots of red in the Amsterdam chart and hardly any in the London chart is that lots of people cycle in Amsterdam and hardly anyone cycles in London. The difference is huge, and seems to be made up by a mix of more travel by car and by public transport in London for trips of between 0.5 and 10 km.

London's high public transport share for medium-length trips (predominantly bus until for trips of up to 6km and predominantly Underground/DLR thereafter) is striking, and I think a little under-discussed in the debate about growing cycling. We have a pretty wonderful public transport network that competes against cycling both in terms of attracting passengers and, in the case of buses, for road space. Even though there is definitely scope for huge growth in cycling with the right policies in place, this starting point probably means we're unlikely to match Amsterdam's modal share even for trips of the same length. Cities can't choose their history, and that can make a huge difference to their future.

* You'll need to request a password to access the full site.

Tuesday, 30 April 2013

Some simple economics of cycling

This post is an attempt to apply some techniques of economic analysis to cycling. There is a growing body of research about cycling, but most of it is from the perspectives of sociology (e.g. these journal papers) or engineering. Those approaches are very valuable (maybe more valuable!), but I think economics might have something to contribute too. However, while economics has had a lot to say about transport in general, as far as I can see this literature has tended to exclude cycling.

But I think taking an economic approach can help us think about some key questions regarding cycling, such as:
  • Why has cycling increased in some city centres even but declined in the suburbs?
  • Why do (some) people cycle in dangerous or unpleasant conditions?
  • On the other hand, why do (most) people not cycle despite the convenience and low cost?
  • What are the real costs and benefits of infrastructure projects or other policies to promote cycling?
Quite a lot of it will seem like simple common sense, or just bloody obvious. But my aim isn't so much to generate any startling insights as to show that cycling can be analysed using the same economic techniques as other modes of transport, and that future research using these techniques may be able to tell us useful things.

Time and money
At its simplest level (which is very much the level this post is written at, since I'm not really an economist), transport economics treats the choice of transport mode for a given journey as a function of a limited number of variables. Generally, the two most important are considered to be speed and cost. Reasonably enough, people are assumed to want to get to their destination as quickly and cheaply as possible.

The standard approach to comparing the speed of transport modes is to use door-to-door times, taking into account any time spent not going anywhere, such as sitting in traffic or waiting for a bus. In economic terms, people consider both the fixed and variable time costs of travel. The chart below illustrates this approach, showing (on the vertical axis) the estimated time taken to travel various distances (on the horizontal axis) in a typical urban environment [1].


Walking is the slowest mode of transport in terms of average speed (as indicated by the slope of its line), but for extremely short trips it is the fastest because there isn't any 'fixed' amount of time you have to spend getting ready, you just start walking. Cycling is the fastest mode for trips of a few kilometres despite having a lower moving speed than cars, because car users are thought to spend more time walking to and from their vehicles. Note, the average moving speed for cars in this chart is about 16km/h, which might seem very low, but that's because it's the average speed and takes into account congestion encountered in urban areas. Because bikes can filter through traffic jams cycling speed is much less affected by congestion and so is almost as quick as driving in this comparison.

This is a highly stylised comparison and you can obviously quibble with any of it, but for our purposes it makes two key points:
1. When thinking about transport speed people consider the total journey time rather than just the average moving speed.
2. On that basis, cycling may be the quickest mode for most short journeys in urban areas. Of course, if congestion is not an issue than the higher speed of cars will make it more attractive, while in extremely congested places cycling will look even better.

What about the monetary cost of travel? This is a bit more complicated, mainly due to the fixed costs involved in owning a car or bike (much less in the case of a bike). But if you set them aside and focus only only on per-trip costs, the important point for our purposes is that the cost of a bike trip is much lower than for any other mode except walking. Even if you take fixed costs into account it's likely that cycling still works out second cheapest for most people.

So if we stop at this point and consider only time and monetary costs, it looks like cycling should be an extremely attractive option for most short urban journeys. It's always cheap, and in congested traffic it's pretty quick. On this basis, cycling should be very popular in congested cities. So why isn't it?

Comfort and safety
Well, with some people it is. A growing number of Londoners, for example, choose cycling over other modes. But even in London cycling's mode share is low compared to its potential, and across the UK as a whole we still cycle very few short or medium-length trips compared to the Dutch or the Germans.

Transport economists have often acknowledged that people take other factors into account when choosing how to travel, with a key factor being the safety or comfort involved. Why 'comfort'? Because people tend to cite safety fears as a reason for not cycling, despite the 'objective' cycling casualty rates being very low even in London and the net health impact probably still positive. This suggests that it's not just the frequency of collisions that people are concerned about but also the frequency of near misses, and the generalised physical and mental discomfort of mixing with motor traffic.

Recently, some researchers have tried to understand how our own safety depends not just on our own choice of mode but also the choices of those around us. For example, in this article Anderson and Auffhammer provide evidence that people in the US are choosing bigger cars in part to protect themselves from the risks posed by everyone else's cars. The result is an 'arms race' in which the average US car becomes (a) bigger and (b) more dangerous to those around it.

Anderson and Auffhammer don't make this connection, but I think you can extend their model to cover cycling, treating bikes as basically extremely light vehicles that offer little or no protection in a collision.  Viewed that way, the choice to drive rather than cycle is similar to the decision to get a bigger car - for many people it is a deviation from their preferred option, motivated by fears over their own safety, that ultimately makes the roads less safe for everyone else too. Played out over a long enough period, it's easy to see how these individual decisions can cascade into a widespread rejection of cycling due to safety fears, as opposed to just the attractiveness of other modes or changing trip patterns.

However, this dynamic won't be the same everywhere. In places where most trips are short and the alternatives are very costly or slow, cycling may still be popular. That's why cycling rates tend to be highest in the centres of big cities - even though there's a lot of vehicle traffic it tends to be slow moving, which makes it less attractive as an alternative means of transport. The mixing of vehicles and bikes, however, means that cycling casualty rates may also be higher in these areas unless safer facilities for cyclists are specifically provided.

So to summarise, cycling has a cost advantage over other modes of transport (except walking, maybe) which is relatively fixed regardless of the conditions, but its relative benefits in terms of speed and safety/comfort are highly dependent on external conditions. Cycling will be quicker than other forms of road transport if traffic is congested, but unless traffic is so congested as to be stationary then the requirement to mix with heavy traffic will also make cycling less safe.

I think this helps make sense of trends such as the fall in cycling in Outer London and the simultaneous rise in Inner London. In Outer London the increasing availability and use of cars and their relatively high speed has cancelled out much of cycling's cost advantage and decreased its safety, while in Inner London high congestion and the falling number of cars has made cycling more attractive despite a still relatively high casualty rate.

Applications
One of the benefits of setting out the cycling decision in an economic framework is that it can allows us to estimate the effects of time, cost and comfort, and that in turn should enable us to make better decisions around infrastructure. Right now TfL are really struggling to properly analyse the costs and benefits of cycling infrastructure, apparently because their models don't incorporate any estimates of mode-switching in response to infrastructure changes, so cycling schemes look poor value for money in contexts where few people currently cycle, i.e. where such schemes may be most needed.

But if we can estimate a statistical model of mode choice with three factors (time, cost and comfort), then we can get at the question of how much additional cycling we should expect to see if we change the infrastructure on a particular route in a way that changes one or more of these factors simultaneously. Such a model could be expressed as something like the following:

Pij = axij + byij+ czij

where Pij is the probability of person i choosing to cycle trip jx is time, y is cost, z is the comfort or cycling level of service, and a, b and c are the relevant elasticities of cycling with respect to each factor. This specification accounts for the fact that infrastructure elasticities will vary by person and by trip, although you could start with some averages.

Estimating this equation from observational data would be challenging, because every trip and every person are different and because simply gathering data on how people perceive safety is so difficult. So you would probably have to start by plugging in average parameter values from existing research about attitudes to generic types of infrastructure and road layout, assumptions about average speed, and so on.  

That way, you can start generating reasonable estimates of how many people might use a particular cycling facility in future, rather than just going on how many people currently cycle the same route. And that in turn means that you can get better estimates of the wider impacts of cycling, for example on how transport changes affect the 'market potential' of particular locations. This kind of analysis is already commonplace for vehicle and rail transport but not for cycling, due I think to a combination of the particular theoretical and empirical challenges posed by cycling and plain old cultural prejudice against what is still seen as an 'outsider' activity.

[1] Source: http://www.infrastructure.gov.au/infrastructure/mcu/urbanpolicy/files/ACTIVE_TRAVEL_DISCUSSION.pdf

Friday, 22 March 2013

Cycling fatality rate about five times as high in London as in Berlin

The other day Danny from Cyclists in the City linked to the city of Berlin's new plan for improving cycling conditions. I haven't been to Berlin for years and don't know what it's like to cycle there, but on the face of it the strategy looks pretty good.

What the strategy documents also allow us to do is compare how dangerous cycling in Berlin is to cycling in London, using the fatality rate per kilometre cycled. Berlin's strategy says (in German) there are 1.5 million cycling trips  a day, at an average of 3.7 km a trip, giving a total of just over 2 billion km cycled per year. And in the last three years there were 26 recorded cycling fatalities or 8.7 per year, giving an annual rate of 0.43 fatalities every 100 million km (or to put it the other way, over 230 million km cycled for each one fatality).

We can get comparable figures for London from the annual Travel in London report and road casualties reports. According to the data on trips per day (table 3.5) and average distance per trip (figure 2.5) in the most recent Travel in London report, there were 0.5 million cycling trips a day in London over the last three years, at an average distance of 3.1 km per day, giving a total of 553 million km cycled per year in London. There were also 39 cyclist fatalities in this period or an average of 13 per year, giving an annual rate of 2.35 fatalities every 100 million km (or just over 40 million km cycled for each fatality).

So it looks like the fatality rate for cycling in London is about five times as high as in Berlin. Note, these figures shouldn't be subject to the same concerns over casualty recording as the serious injury rates I calculated before, as fatalities are much less subject to under-recording than injuries.

Here's a table with all the numbers:

LondonBerlin
2009201020112009-112008-10
Trips per day (millions)0.470.490.500.491.50
Distance per trip (km)2.993.313.043.113.70
Total distance per year (m km)5125915555532,026
Fatalities in period1310163926
Fatalities per year131016138.7
Annual fatalities per 100m km2.541.692.882.350.43
Million km per fatality39593543234

Monday, 4 March 2013

Mapping cyclist casualty concentrations in London

I've produced some maps of London cycling casualties on this blog before but it's hard to come up with an image that manages to capture both the scale and the spatial specificity of the issue. It matters where cycling casualties happen and it also matters how many there are in a particular area, but at the London-wide level there are so many that the most straightforward visualisation techniques just aren't adequate, even before you start trying to understand the underlying patterns of exposure and causation.

Here, for example, is a simple map showing one dot for every recorded cycling casualty in London over the five years to 2011 (the most recent year available). It includes fatal, serious and slight casualties, with the latter category by far the largest.
This map does tell us some useful things: cycling casualties are heavily concentrated in central London, and judging by the linear patterns seem to be common on major roads too. But there are so many casualties in the centre that the image becomes overwhelmed and you lose a sense of either scale or space. Some kind of aggregation would help.

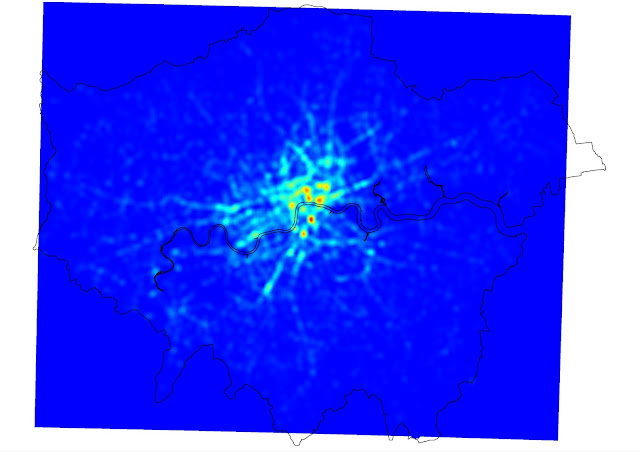
Following the steps outlined on the Mapbox blog here, I generated a 'heatmap' of cycling casualties in Quantum GIS. A heatmap is a technique that uses spatial interpolation to predict the number of events (in this case, cycling casualties) in a small part of an area based on the actual number observed in or close to that area. It smooths out the pattern a bit and highlights with variations of colour the locations with the greatest concentrations.

If anything, this shows even more clearly how many casualties there are on London's major roads (including many of the ancient Roman routes shown recently on the Mapping London blog). I thought it could do with a bit more clarity, so, again following the Mapbox tutorial, I added some definition using contour lines, and a legend.  Note that the heatmap model 'predicts' 140 casualties in the deepest red cells and zero in the deep blue squares that cover most of the suburbs.


Maybe the contours look a bit messy at the London-wide scale but when you zoom into the city centre I think they help, partly by overcoming the blockiness of the heatmap results. In the map below I've labelled the areas in central London with the greatest concentrations of cycling casualties in the last five years. As you can see, the Elephant and Castle area is pretty clearly the worst in terms of the number of casualties, while there is a cluster of areas just north of the river also focused on major junctions.


Finally, here's a version with the street network showing underneath.

Sunday, 10 February 2013

A couple of maps showing where in London cycling commuting did and didn't grow between 2001 and 2011

A couple of weeks ago I posted a map showing the mix of commuting modes by ward in London from the 2011 Census, and this week I'd like to focus on the change in cycling levels since 2001. The maps below (click here and here for PDF versions) show the change in cycling, again at ward level, first the change in the number of people cycling to work in each ward and then the change in cycling's share of all commuting. I've included both because the numerical increase is interesting but can be distorted by differences in population growth.


In both maps the yellow areas represent areas of decline, the greens no change or moderate growth, and the blues higher rates of growth.

Growth in cycling commuting is concentrated in inner London and the South West, with the greatest increase in both proportional and absolute terms in Hackney. A couple of other patterns jump out: the rich boroughs of Westminster and Kensington and Chelsea are exceptions to the inner London rule, showing very little growth in cycling over the last decade, probably due to a combination of car-friendly policies and demographic factors. Newham also stands out as showing very little growth, suggesting that the river Lee or rather its crossings may be quite a significant barrier, hopefully something the new superhighway will address. South of the river there look to be pockets of high growth, in numerical terms at least, along the routes of Cycle Superhighways 7 and 8 and in a few other areas.

But while most of inner London saw pretty good growth in cycling over the decade, Hackney is clearly the star of the show. In 2001 4,940 people in Hackney said they cycled to work. By 2011 that had more than trebled to 17,312. Hackney's workforce grew at the same time, but there was a big increase in cycling's commuting mode share too, from 6.8% in 2001 to 15.4% in 2011 (in both cases excluding those working from home). In five wards cycling's mode share grew by more than ten percentage points. As Cyclists in the City pointed out, more people commute by bike in Hackney than by car or van.

There's an interesting debate to be had about whether the Hackney trend is due to demographics (an influx of young carless people), the emergence of a fairly localised pro-cycling sub-culture, or Hackney council's approach to road safety. Danny says here it's about policies and I've no doubt they're an important factor, but in my admittedly partial experience cycling in Hackney is no better than in Islington so I suspect demographics and culture have played a role too. We may know a bit more when more detailed Census data on who is cycling where comes out later in the year.

Thursday, 31 January 2013

The colour of London's commute

Today saw the release of detailed Census data on, among other things, the mode of transport those in work use to get to work. One interesting aspect of this is the rising level of cycling in London, as described here by Cyclists in the City. I'll probably be looking at that later in the week, but first here is a map which attempts to summarise the transport mix across all of London in a single image.

(Click to embiggen, and higher-quality PDF here)

What the map shows is the mix of transport to work of residents living in each part of London*, using ONS data at Middle Super Output Area (MSOA) level. Each MSOA is given an RGB colour determined by the modal share, with red colours representing travel by car, taxi or motorbike, blue travel by public transport and green cycling or walking.

The result is a fairly simple pattern, with motor vehicles predominating on London's fringes, public transport in the inner suburbs and cycling and walking in the very centre. Those tendrils of blue reaching out presumably represent major public transport links.

A few details about the mapping technique for anyone who's interested: I was inspired to use the RGB approach by James Cheshire's map of election results and after some trial and error found a fairly simple way to do it in R which I can provide more details of to anyone who asks. The data and boundaries are both from ONS, the former downloaded from Neighbourhood Statistics. The maps exclude those people of working age who are not in work, who work from home or who use some form of transport so strange that ONS only describe it as 'other'.

* Edited this to make it clear that the map is based on place of residence, following @santacreu34's helpful comment.

Sunday, 27 January 2013

Seasonality of road casualties

The other day a few people were discussing on Twitter whether cycling was statistically more dangerous, in terms of casualties per mile, during winter than during summer. This is something I tend to wonder while cycling home in the dark, so I thought I'd try and investigate.

I used DfT's data on reported road casualties in 2011,  the most recent year available. Using just one year's data means the patterns observed may be affected by unusual weather patterns in that year, so you should treat the results as fairly provisional. Another issue with the data is unreporting, so I have focused on fatal or serious injuries which we assume are less likely to be unreported.

Most of the data cleaning and analysis was done with R, and I've copied my code at the bottom of the post. I'm no expert at R so I'm sure the code could be improved, but if anybody wants to use it then feel free.

The DfT data includes all kinds of roads casualties including those suffered while atop horses or tractors, but to keep things simple I've restricted the analysis to pedestrians, cyclists and car occupants (excluding taxis and private hire vehicles). The chart below shows the total number of fatal and serious casualties in England and Wales by road user type and month in 2011:


You can see the different patterns for each mode more clearly if you split them out:


What you see are very clear seasonal patterns for pedestrians and cyclists, with pedestrian casualties rising as winter draws in and then reaching a trough in summer, and cyclist casualties following more or less an opposite trend. There doesn't seem to be much of a pattern for car occupants, although the number of casualties is highest in December and January.

Here's the same chart for London:


The raw numbers shift around a lot because London's mode share is so different, with a lot more pedestrians and cyclists and less car traffic than in the rest of the country. But the seasonal patterns look a little different too. In particular there is a much bigger increase in pedestrian casualties towards the end of the year, and December has nearly twice as many as January.

For cyclists the obvious explanation for higher casualties in summer months is that more people cycle at that time of year. For pedestrians the logic is less clear. It doesn't seem likely that there is much more walking done in the winter months than in the summer. So the winter months, particularly December, just seem to be more risky. Nationally, the worst days for fatal or serious pedestrian casualties in 2011 were the 9th, 12th and 16th of December. There was plenty of snow that month but I wonder whether there is also some sort of 'Christmas party effect' at work here, on both pedestrians and drivers (by the way, in the US the deadliest day for pedestrians is apparently New Year's Day - see also this).

To calculate a casualty rate you divide casualties by some measure of traffic or trips. For pedestrians there's no such data that I know of. But TfL count cars and bikes passing various points on the London road network, and they have made the cycling data available via FOI in the form of this big Excel spreadsheet. This data is patchy for some count points but you can fill in the gaps with estimates based on the ones with complete data.

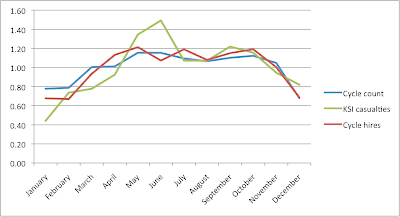
The other option for estimating monthly cycle trips is to use TfL's counts of cycle hires. The chart below compares monthly trends in fatal/serious bike casualties, TfL cycle counts and cycle hires, by expressing each month's figure as a ratio of the average.


Now, you probably shouldn't read too much into this comparison as it's comparing one imperfect data source with another two imperfect ones gathered at different spatial scales. But it does look like there is a bigger increase in casualties between January and June than there is in either of the trip indicators. This suggests, again very provisionally given the limitations of the data, that the number of casualties per cycling trip may be lower in the first few months of the year than in summer.

We really need a more comprehensive analysis to establish if this really is the case, but if it was what would explain it? Perhaps people who cycle all year may be more careful or skilled than those who only take to their bikes in summer. Maybe drivers may look out for cyclists more in winter. At this stage, we just don't know.


Thursday, 17 January 2013

Bike lanes, livability and displacement

The fact that the Evening Standard's property section is now running features about "good-value homes within cycling distance of the office" is good news for cycling as a cause, but perhaps not so good if you're just a normal self-interested cyclist.

Back in the good old days when cycling in London was a freakishly unusual thing to do, whether some place was within cycling distance of the City or not didn't affect its valuation much because there weren't enough cyclists for it to matter. So if you happened to be one of that small number of cyclists you enjoyed a quick commute without having to pay a price premium for it.

But now that cycling has become popular enough in Inner London for even estate agents to notice, "within cycling distance" has become a saleable feature and accordingly comes with a price tag. Given enough cyclists, things like infrastructure quality will start affecting prices too: if someone builds a great bike lane from your flat to the City then more people will want to move there to avail of it, overall market demand will go up and so will the property value.

Now, if you use the bike lane enough you might think the higher price is still worth it. And if you already own a flat in the area you might be pleased too, even if you don't use the bike lane, because your property value just went up. But tenants who don't cycle will be worst off as they'll see their rent go up for no benefit.

This kind of concern is why people sometimes campaign against what others see as entirely benign neighbourhood improvements, and it's what motivates polemics like this one against "livability" defined in terms of supposedly ephemeral amenities like bike lanes rather than the more 'real' livability concerns of jobs, transport and housing.

Campaigns against bike lanes can seem fairly insane, and to be honest sometimes they are, but sometimes they are part of a wider struggle over processes of neighbourhood change, gentrification and displacement. Advocates of livability improvements generally don't intend to displace anyone, but in my view it is irresponsible to not at least consider these price effects and the likely social consequences.

Displacement is not inevitable, though. Higher housing demand can be offset by higher housing supply, moderating or even eliminating the price impact while enabling more people to enjoy these new amenities. Of course, people tend to be hostile to new housing supply in their area so campaigners usually choose to avoid the topic, but there's really no getting away from the market dynamics. If you make a place more attractive without making it possible for more people to live there, prices will go up and people will get displaced. Is that really what you want?

Sunday, 13 January 2013

Surveys about cycling


Just a quick post about a couple of interesting surveys of people's attitudes to different types of cycling infrastructure. First, via Ian Walker on Twitter, is a survey in the Vancouver region which found:
The best route types to encourage cycling were:
- paved off-street bike paths
- residential streets with traffic calming
- cycle paths next to major streets, but separated from motor vehicles by a curb or other barrier (also known as "cycle tracks")
The findings include this chart showing how regular, occasional and 'potential' cyclists all feel about different types of route and infrastructure.

16 Route Types, Average Likelihood of Choosing by Cyclist Type
Second, a survey in Bristol which is interesting because it asked non-cyclists their views on cycling provision:
When asked to assess their cycle route to work, only 10% of non-cyclists were happy with their commute's cycling potential (indicated by a rating of 'excellent', 'very good' or 'good'). 21% said it was OK, and 35% said it was poor or very poor, with the other third of respondents unsure. 
72% indicated that their major reason for not cycling to work was because it would be 'unsafe/stressful' to do so. This was the stand-out response. Reinforcing this response, almost exactly the same number (71%) of non-cyclists agreed that they would consider cycling more frequently if safe, well-connected, physically segregated cycle ways were provided for the majority of their commute.

Tuesday, 1 January 2013

People in London go out of their way to avoid cycling on busy roads

Transport for London's latest annual Travel in London report is, as usual, full of interesting information. I found this paragraph from p. 122 on attitudes to cycling particularly striking:
Cyclists generally feel safer on quieter roads. A survey of Londoners found that cyclists consider quiet roads to be safer than busy roads. Four-fifths consider quiet roads to be safe, compared with 49 per cent (regular cyclists) or 28 per cent (occasional cyclists) for busy roads. A recent study of current cyclists in London found that cyclists were willing to increase their journey time to travel on better, safer routes. Current London cyclists are prepared to travel further to cycle in cycle lanes, bus lanes, on residential roads and would travel three times further to cycle on off-road routes. Around half of all cyclists would change their route to travel through parks and green spaces, or to travel on a dedicated on-road cycle lane. And around 40 per cent said they would change their route in order to use a Cycle Superhighway.
The key fact is that only 28% of occasional cyclists in London think busy roads are safe, compared to a majority who think quiet roads are safe. That may sound obvious to some, but to me it shows illustrates two important points:

  • Most people don't think cycling itself is unsafe, just cycling in heavy traffic.
  • Busy roads are more likely to have cycling 'infrastructure' such as advisory cycle lanes, but they don't seem to have much impact on safety perceptions. This suggests we need better infrastructure, a la the Netherlands.
The research about how far out of their way people are willing to go for a safe cycle route is also important. Choosing a slower but safer route is a form of 'avertive' behaviour, just like people moving away from a polluted road. It lowers the observed costs in the form of road accidents (or respiratory disease from the polluted road) but it increases the hidden costs borne by people in the form of higher expenditure of time or money to avoid the problem. Avertive behaviour prompted by unsafe cycling conditions ranges from finding a slower but safer route to spending loads of money on luminous clothing to not cycling at all. These costs are very large but to my knowledge are not well accounted for in current transport assessment methods.


Monday, 3 December 2012

A few notes on getting Britain cycling

The All Party Parliamentary Cycling Group is holding an inquiry into how 'Get Britain Cycling' and they want evidence by the 5th, so the following is just some notes for my submission, mainly to get me to write something down rather than endlessly opening more browser tabs.

There is a large latent demand for cycling that is not being realised because of safety concerns
Just 2% of trips under 2.5km are cycled in the UK, compared to 14% in Germany, 27% in Denmark and 37% in the Netherlands (Pucher and Buehler).

Research by Transport for London found that only 7% of 'potentially cyclable' trips in London were currently cycled, and that safety (the lack of it, more precisely) is the greatest barrier to cycling.

A large DfT survey carried out in December 2009 found that:
  • 60% of people who can ride a bike say it's too dangerous for them to cycle on the roads, including 71% of women and 72% of those aged 60 or over.
  • 52% agree they would cycle more if there were more dedicated cycle paths (30% disagree).
  • 86% of people say that cycling is the least safe form of transport.
In 2011, two thirds of people in the British Social Attitudes survey said they were not very or not at all confident about cycling on the roads (DfT table).

Research shows that high quality, separated infrastructure is safest and most popular
  • "The key to achieving high levels of cycling appears to be the provision of separate cycling facilities along heavily travelled roads and at intersections, combined with traffic calming of most residential neighbourhoods". Pucher and Buehler, 2007
  • "Consistent with gender differences in risk aversion, female commuter cyclists preferred to use routes with maximum separation from motorized traffic. Improved cycling infrastructure in the form of bicycle paths and lanes that provide a high degree of separation from motor traffic is likely to be important for increasing transportation cycling amongst under-represented population groups such as women". Garrard et al, 2008.
  • "The greater the physical separation from motor vehicle traffic, the higher the women's share of cyclists". Pucher et al, 2010.
  • "The lower risks on quiet streets and with bike-specific infrastructure along busy streets support the route-design approach used in many northern European countries. Transportation infrastructure with lower bicycling injury risks merits public health support to reduce injuries and promote cycling". Teschke et al, 2012.

We have a severe shortage of the right kind of cycling infrastructure
The under-utilisation of bikes for short trips, the survey findings on subjective safety and the high casualty rate in places where cycling is more popular all point to a widespread and severe lack of high-quality cycling infrastructure in Britain.

To get Britain cycling in safety central government must urgently address this deficit by
  • Revising DfT cycle design guidance so that high-quality, Dutch-standard cycling infrastructure is given the highest priority;
  • Making available sufficient ring-fenced funding to introduce high-quality separated cycling infrastructure in towns and cities across Britain in the next five years;
  • Allocating this funding through a competitive bidding round in which funding goes to the proposals that combine the highest quality design with the greatest impact in terms of current and potential cycling demand.
Leadership from central government is vital 
Many local authorities lack understanding or expertise in designing for cyclists, and in many parts of the country so few people cycle that they hardly impinge on local political consciousness at all. The fastest and best way to get local authorities to act is for central government to provide the right funding and the right guidance.

Higher rates of cycling will save people money and bring wider benefits
  • In total, people in Britain cycle about 3.1 billion miles a year (DfT). 
  • But on a per person per day basis, people in the Netherlands cycle about 12.5 times as much as those in the UK (Pucher and Buehler). 
  • That suggests that if people in Britain individually cycled as much as the Dutch we'd cover about 39 billion miles a year. 
  • According to these figures from Edinburgh cycling saves you between 55p and 60p per mile compared to driving, taking all costs into account. 
  • So people in Britain are already saving almost £2 billion a year by cycling instead of driving, but if they cycled at Dutch rates they would save over £20 billion.
  • These figures may be a touch too high, since there are other (and usually cheaper) alternatives to cycling than the car. They're also fairly dependent on volatile variables like petrol prices.
  • But they also exclude the wider social and environmental benefits of cycling and driving, which are very large (even taking into account higher average casualty rates from cycling), perhaps three times as high as the private cost savings (Figure 3.1 here).
  • So it's probably fair to say that achieving cycling rates akin to those in the Netherlands would deliver private and social benefits to the value of tens of billions of pounds. 

Saturday, 22 September 2012

Reviewing TfL's road safety plan, Part 2: Which target?

This is the second post looking at Transport for London's draft road safety plan, which is out for consultation here until the 28 September. Whether you agree with the draft plan or not I encourage you to respond to the consultation: 2,805 people were recorded as killed or seriously injured on London's roads in 2011 alone, so this stuff matters.

In the first post I reviewed TfL's take on recent casualty trends in London, noting that the target to halve the number of cyclists killed or seriously injured ('KSI', in the jargon) on London's roads was missed, with the number of KSI falling by just18% compared to a 57% drop in overall casualties (see chart below from the last annual report).
TfL argued that this failure was due to the enormous growth in cycling over the same period. Which is largely true - but then why not set a target to reduce the rate of cycling casualties per trip or per kilometre cycled? As I mentioned earlier this month, TfL have recently calculated casualty rates per 100 million kilometres travelled by different modes in London, and the Department for Transport also do a similar calculation by region, so the information is available to monitor such a target. And according to the Road Danger Reduction Forum, TfL have said in the past that they intended to adopt rate-based casualty reduction targets to deal with this problem of absolute casualty targets being affected by changes in trip rates. Finally, the government's new road safety framework proposes rate-based casualty reduction targets at the national and local level (see p.72 here).

These are all good reasons to adopt a target to reduce the rate of cycling casualties per distance travelled, and similar targets for other modes. But TfL have decided against such a target; in fact they have decided against having any target of any kind to reduce cycling casualties. Instead, they propose a target to reduce the absolute number of all KSI road casualties by 40% by 2020 from the base period of 2005-09.

TfL describe this proposed target as 'challenging' (p. 26 of the plan), but when you look at their own chart it doesn't really seem all that challenging.
The number of serious or fatal road casualties in London fell by more than half in the nine years between 2001 and 2010, and reached a low of 2,805 in 2011. TfL are proposing to reduce it to 2,176 by 2020, which would be a reduction of 22% over the next nine years, comparatively a much slower rate of reduction.

So this proposed target sounds distinctly unchallenging, even if you assume, as I think TfL must be doing, that traffic starts growing strongly again during the period. Another partial explanation is offered on the same page, when TfL say that this target "is based on the assumption that the existing road safety programme continues, but does not include the effects of any new measures". In other words, TfL aren't including the effect of any improvements from the junction review or any attempts to 'Go Dutch' in terms of cycling infrastructure. Whether that is because they don't know what to expect from these policies, or know not to expect very much, is not made clear.

All this stuff about targets might seem like fairly irrelevant bureaucracy to some, but I think it does matter, because genuinely challenging targets with a high political priority attached do in practice lead to the re-allocation of resources, and because they can help to focus minds and change cultures within bureaucracies. TfL have recently given hints that they are genuinely changing their policies and practices to reflect a new focus on reducing road danger, but this draft road safety plan and the main target proposed don't seem to reflect any of that. I think if cycling is to get significantly safer in London then we need to focus TfL's minds on reducing the casualty rate, and the road safety plan is a good place to start with that. If you agree, write to them and say so before the 28th.

Monday, 17 September 2012

Reviewing TfL's draft road safety plan

Transport for London are currently consulting on a draft new Road Safety Plan for London which sets out proposed targets and policies for the period up to 2020. The consultation period closes on 28 September and I strongly encourage everyone to respond - there is a questionnaire you can fill out to make it a bit easier.

I plan to do a few posts analysing the draft plan in detail, as it's quite an important document. This first post looks at how TfL describe recent trends in road safety in London; the next one will probably focus on the target they propose to adopt, and the last will look at some of the policies they do and don't propose to implement.

The number of road casualties, including the number involving fatal or serious injuries (crudely abbreviated in the jargon to 'KSI' for 'killed or seriously injured'), has fallen substantially in London over the last couple of decades, and TfL are rightly keen to highlight this. The headline figure is that the number of KSI casualties in 2010 was 57% lower than the average figure for 1994-98, which has been used as the baseline until now. This means that the overall target in the original London Road Safety Plan (first published in 2001 and then updated with tougher targets in 2005), for a 50% reduction in KSI casualties by 2010, was met.

But that first Road Safety Plan didn't just set an overall target for road casualty reduction. There were targets for individual modes too, to try and ensure that casualties were reduced across the board. Following the 2005 review, these mode-specific targets were:

  • A 50 per cent reduction in the number of cyclists and pedestrians killed or seriously injured 
  • A 40 per cent reduction in the number of powered two-wheeler users killed or seriously injured

There was also a specific target to reduce the number of children killed or seriously injured by 60%.

The targets for KSI casualty reductions among cyclists and motorcyclists were not met. As the chart below (from the last annual monitoring report) shows, the number of cyclist KSI casualties fell by only 18% and the number of motorcyclist KSI casualties by 34%.

Strictly speaking, then, the original road safety strategy failed to meet its targets. TfL, however, argue that the failure to hit the targets for cyclists and motorcyclists was due to large increases in both cycling and motorcycling in London, and that the underlying casualty rate for both modes actually decreased.

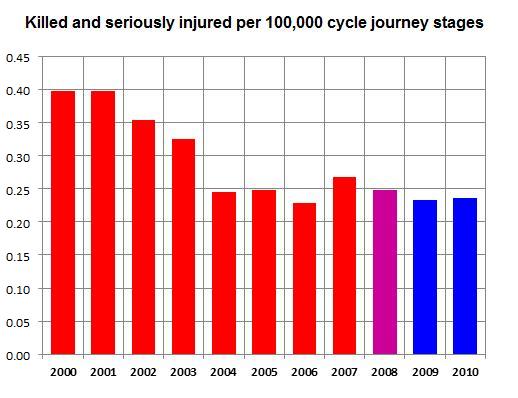
I don't know much about motorcycling trends but over the longer term it is certainly true that the cycling casualty rate has fallen in London - see, for example, the chart below produced by Fullfact.org from TfL data.


There are a few things you could say in response to this argument. The most obvious is that they can't have it both ways - TfL's target was to reduce the absolute number of cycle and motorcycle casualties, and if you go back to the 2001 road safety plan you can see that this target was set in the knowledge that use of both modes was rising. Secondly, if they now think that the rate of casualties per trip or per mile travelled is more important, then why not make that the target, or better yet set a target to reduce both the rate and the number of casualties? Thirdly, it is clear from the chart above that the cycling casualty rate pretty much flatlined between 2004 and 2010. And that trend doesn't include 2011, which saw a 22% increase in fatal or serious cycling casualties, probably outpacing the growth in cycling journeys. Again, if the cycling casualty rate is so important, isn't the record of the last several years rather worrying?

I'll look at some of these issues in the next post, which is about what target should be set. For now, I'd encourage everyone again to read the proposed new plan themselves and respond to the consultation.

Tuesday, 11 September 2012

More cycling than car traffic in central London during the Games?

Just a quick post speculating on a couple of interesting bits of info about transport trends in London. First, according to @bitoclass on Twitter TfL have said that cycling in London increased 22% during the Olympics (presumably compared to last year). Second, TfL have also said that vehicle traffic in central London fell considerably during the Games period, though I haven't seen any firm figures. Third, recall that even before the Games car traffic in central London was falling and bike traffic rising, with the two looking likely to converge pretty soon:


Putting these together, my guess is that cycling accounted for more journeys than cars in central London during the Games period, for the first time in probably 60 years or more. Quite a milestone if so.

[Update: Paul (@bitoclass) has kindly posted a pic of the TfL presentation slide which was the source of his factoid:


So traffic in central London was down by 5-10% in August this year compared to August 2011, and it was cycling across the Thames bridges that was up by 22%. In recent years, growth in cycling across the Thames has lagged slightly behind growth in central London (see table 8 on p.20 here) so it's quite possible that cycling in central London grew by 25% or more.

In any case, we'll probably have to wait until January or so for TfL to update the trend in my chart above. From a policy perspective, perhaps the more interesting question is whether these short-term changes in travel patterns will persist. Cycling through central London yesterday it certainly felt like the vehicle traffic was still very light, but in the absence of any more restrictions I would expect it to creep back to something close to pre-Games levels over time. Or perhaps it won't, if cycling levels stay high - after all, it does seem like once people make the leap to start cycling that a lot of them find it works for them, and in one way or another the Games have probably encouraged plenty of people to make that leap.]

Monday, 10 September 2012

The fatal/serious bike casualty rate per km in London is 30x that for cars; And why bikes need more space because they take up so little

TfL have published a study (under 'Research reports' here) entitled 'Levels of collision risk in Greater London' that I think only gets really interesting on the very last page. Table 4.10 on that last page includes what I think are the first TfL calculations of casualty rates per kilometre travelled in London for different modes of transport. By combining the number of casualties in 2010, estimates of total distance travelled by each mode and assumptions on the average occupancy of each mode, they come up with the following figures for the rate of fatal or serious casualties per 100 million 'passenger kilometres'.

In case you can't read the numbers, they are 73.9 for bikes, 84 for motorcyclists, 2.5 for cars and taxis, 1.0 for buses and 0.4 for goods vehicles. So some good news for our put-upon HGV drivers there. The other interesting thing (okay, maybe only to me) in that table are the TfL estimates for average occupancy of different modes. They say the average car has 1.2 occupants, the average bus 16.6, the average bike just 1 (what, no backies?). Bear in mind that TfL already assume (table 1 on p. 67 of this PDF) that on average a bike takes up just 20% of the road space that a car does (in technical terms it has a 'PCU' or Passenger Car Unit of 0.2), a bus takes up twice as much, and so on. Put these two sets of numbers together and you get a figure for 'Persons per PCU', which is basically a measure of how efficiently each mode of transport uses road space.

Persons per vehicle PCU per vehicle Persons per PCU
Cyclist 1 0.2 5
Motorbike 1 0.4 2.5
Car/taxi 1.2 1 1.2
Bus/coach 16.6 2 8.3
Goods vehicle 1.3 1.65 0.8

Going by these figures, buses use the road space most efficiently (NB none of this includes energy efficiency) and cars the least efficiently (goods vehicles are there to carry goods not people so this measure has fairly limited application to them). Referring back to the figures on casualty rates, we can conclude that buses are both very safe and very space-efficient, which is great, while bicycles are very space-efficient but (relatively speaking) much less safe, which is bad. Obviously cycling could be a lot safer if London had cycling facilities like they do in Amsterdam, Copenhagen, Berlin, Stockholm and various other European cities. The high space-efficiency of cycling is, I think, just another reason that TfL should be copying what those cities have done - that is, giving bikes more space in part because they take up so little.