Cyclists make these kinds of calculation all the time. They take quiet back streets to avoid dangerous main roads, they dismount and cross at pedestrian signals rather than try to turn right across moving traffic, and so on. There are a number of daredevils who take the most direct route to where they're going regardless of the conditions, but in my experience almost everyone who cycles accepts some kind of delay or diversion in exchange for extra safety, comfort or peace of mind.
But that's just the people who cycle, and in Britain they are relatively few in number. Most people don't cycle, presumably because they don't think it worth their while. On the face of it this is a puzzle, since cycling can be faster than driving or other modes of transport in many contexts. But the reality is that this speed advantage can be wiped out if you have to make too many of these delays and diversions to make the trip acceptable by bike. If people have to go around the houses to feel safe on a bike, many of them will just take the car instead.
The flip-side is that if we can make the quick and direct routes safe and comfortable to cycle, then many people will find that cycling suddenly makese sense for them. This is what happens in the Netherlands, where people are not expected to either brave unpleasant conditions on main roads or work out a convoluted but quiet route on back roads. By making cycling safer, they have made it quicker too, and that's the key.
Evidence on how far people will go out of their way to avoid unpleasant or dangerous roads has long been one of the missing pieces in understanding the choice of whether or not to cycle. If we knew how much time people would give up to avoid a bad junction, we can guess how much time we could save them by making it safe and pleasant to cycle through, and then estimate the impact on cycling's local mode share, traffic congestion and so on. These factors are key to the kind of economic analysis which determines how transport funding gets spent and which has so far more or less ignored cycling.
So this research into cyclists' route choices carried out for TfL by Steer Davies Gleave could be very important, because it tries to answer exactly these questions. They asked people (mostly people who cycle in London) to rate the attractiveness of different types of junction types and cycling conditions, and crucially it asks them how much time they would be willing to add to their journey to avoid particular situations.
Here are some of the results. First, the extent to which people agreed with various statements about route choice, by their frequency of cycling, age and gender.


The first thing to note is how many people, even frequent cyclists, agree with statements like "If I had to negotiate a number of difficult junctions I would try to find another route" and "I would prefer cycling in a cycle lane which is separate from the traffic even if it meant a longer journey". But the different average responses by gender are striking too: women seem significantly more likely to change their routes due to safety concerns than men, consistent with findings from the British Social Attitudes survey showing women are more likely to think the roads are too dangerous to cycle. Finally, long-term cyclists (those with more than two years experience) are consistently more willing to endure bad conditions in exchange for a quicker journey than inexperienced ones. There is probably a learning or hardening effect here, with people becoming more skilled or better able to cope with unpleasant conditions over time - but there is undoubtedly a selection effect too, with many people trying out cycling but not keeping it up due to safety issues. Experienced cyclists constitute the small minority of people who are willing and able to deal with the problems posed by cycling on British roads.
The researchers also asked people to rate how safe they felt cycling through different types of junctions.

Here, the striking thing is how unsafe people (mostly cyclists, bear in mind) think fairly common junction types are. The very first junction in my five-mile commute to work is a right turn from a side road onto a main road, and it's not very nice: I have to wait for a suitable gap in the streams of traffic and then dart into it at a decent speed. Clearly for many people this would be one junction too far and the journey as a whole would be unviable by bike.
The next charts illustrate how important this all is.

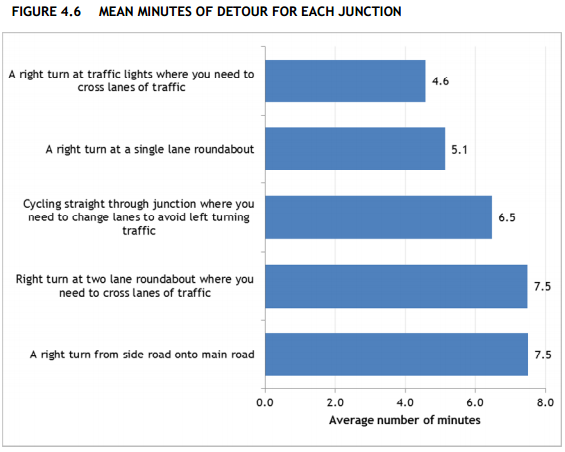
A majority of people said they were willing to accept a detour of over five minutes to avoid a right turn at a two-lane roundabout, or a right turn from a side road to a main road. The average was 7.5 minutes. These are very big figures, surprisingly big to me at first - but I'm an experienced, battle hardened cyclist, and as I said at the start I still make detours, though maybe not as big.
It's worth emphasising again that these kinds of results go a long way towards explaining why more people don't cycle in Britain. It's because our main roads are so dangerous and unpleasant to cycle on that people would rather sacrifice huge chunks of time than do so, to the extent that cycling is for most purposes no longer worthwhile.
Finally, the researchers asked people to compare different types of cycling facility. The chart below shows the average benefits people ascribed to each type of facility, with the most popular (off-road routes) set at 100.


The key result here is that there is a big preference for off-road cycling infrastructure as compared to bus lanes, advisory cycle lanes or mandatory cycle lanes, particularly among women. In comparison, the type of road doesn't seem to matter very much.
This certainly looks like a big win for segregated bike lanes (consistent with lots of other evidence on the subject), but it's worth bearing in mind that the picture of an 'off-road' route people were prompted with (below) looks more like a route through a park than a typical segregated track alongside a main road, and that has probably affected the results somewhat.

This is very valuable research because it starts to quantify the extent to which our current road designs fail people and prevent cycling from becoming a mainstream choice, and because it can also help us quantify the benefits of better infrastructure. It deserves to be read widely, by both campaigners and planners.