Here, for example, is a simple map showing one dot for every recorded cycling casualty in London over the five years to 2011 (the most recent year available). It includes fatal, serious and slight casualties, with the latter category by far the largest.
This map does tell us some useful things: cycling casualties are heavily concentrated in central London, and judging by the linear patterns seem to be common on major roads too. But there are so many casualties in the centre that the image becomes overwhelmed and you lose a sense of either scale or space. Some kind of aggregation would help.
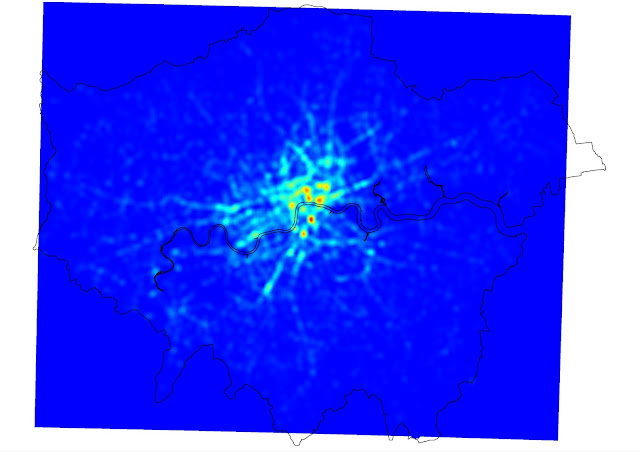
Following the steps outlined on the Mapbox blog here, I generated a 'heatmap' of cycling casualties in Quantum GIS. A heatmap is a technique that uses spatial interpolation to predict the number of events (in this case, cycling casualties) in a small part of an area based on the actual number observed in or close to that area. It smooths out the pattern a bit and highlights with variations of colour the locations with the greatest concentrations.
If anything, this shows even more clearly how many casualties there are on London's major roads (including many of the ancient Roman routes shown recently on the Mapping London blog). I thought it could do with a bit more clarity, so, again following the Mapbox tutorial, I added some definition using contour lines, and a legend. Note that the heatmap model 'predicts' 140 casualties in the deepest red cells and zero in the deep blue squares that cover most of the suburbs.
Maybe the contours look a bit messy at the London-wide scale but when you zoom into the city centre I think they help, partly by overcoming the blockiness of the heatmap results. In the map below I've labelled the areas in central London with the greatest concentrations of cycling casualties in the last five years. As you can see, the Elephant and Castle area is pretty clearly the worst in terms of the number of casualties, while there is a cluster of areas just north of the river also focused on major junctions.
Finally, here's a version with the street network showing underneath.


It would be interesting to factor in cycle traffic too to check for correlations between injuries and traffic.
ReplyDeleteElephant & Castle is a horrible junction to try and get around. It's effectively a motorway-style road with 4 traffic lanes in each direction, and a mish-mash of lights and give way lines. Traffic doesn't always yield to other vehicles on the right, particularly if you're on a bike, and many drivers find they need to change lanes, which is very tricky at busy times, when there is a high volume of buses and bikes. To further complicate things, you've got a very large volume of people on foot trying to cross the road, often through traffic rather than using the crossings/subways. It doesn't work well for anyone. Unfortunately, efforts to redesign the junction have been hampered by TfL's reluctance to limit the traffic flow. Replacing the Walworth/Kennington roundabout with a light-controlled junction was a step forward, it's time they did the same with the northern roundabout.
ReplyDeleteI used to loathe Elephant and Castle back when I was a pedestrian (you were forced into a series of labyrinthine tunnels, badly-lit and smelly as I remember, not sure if it still works like that), as a cyclist its terrifying.
DeleteIt is just about possible to bypass it for many cycle journeys, at the expense of a significant detour, though that leads to the normal problem of having to come out of side streets to cross busy roads, with no real provision for cyclists (apart from one spot on CS7 which has those useless cycle-crossing lights that always seem to be permanently stuck on red).
I reckon they should just dig a whacking great tunnel under it and put the cars underground and let human beings who aren't wielding deadly weapons, whether pedestrians or cyclists, stay in the daylight on the surface.
There is an alternative cycle route marked round all 4 sides of that junction (part of it is also a bit of CS7) and some people use it but for some reason many don't. Do they not know about it?
ReplyDelete