Tuesday, 30 April 2013

Some simple economics of cycling

This post is an attempt to apply some techniques of economic analysis to cycling. There is a growing body of research about cycling, but most of it is from the perspectives of sociology (e.g. these journal papers) or engineering. Those approaches are very valuable (maybe more valuable!), but I think economics might have something to contribute too. However, while economics has had a lot to say about transport in general, as far as I can see this literature has tended to exclude cycling.

But I think taking an economic approach can help us think about some key questions regarding cycling, such as:
  • Why has cycling increased in some city centres even but declined in the suburbs?
  • Why do (some) people cycle in dangerous or unpleasant conditions?
  • On the other hand, why do (most) people not cycle despite the convenience and low cost?
  • What are the real costs and benefits of infrastructure projects or other policies to promote cycling?
Quite a lot of it will seem like simple common sense, or just bloody obvious. But my aim isn't so much to generate any startling insights as to show that cycling can be analysed using the same economic techniques as other modes of transport, and that future research using these techniques may be able to tell us useful things.

Time and money
At its simplest level (which is very much the level this post is written at, since I'm not really an economist), transport economics treats the choice of transport mode for a given journey as a function of a limited number of variables. Generally, the two most important are considered to be speed and cost. Reasonably enough, people are assumed to want to get to their destination as quickly and cheaply as possible.

The standard approach to comparing the speed of transport modes is to use door-to-door times, taking into account any time spent not going anywhere, such as sitting in traffic or waiting for a bus. In economic terms, people consider both the fixed and variable time costs of travel. The chart below illustrates this approach, showing (on the vertical axis) the estimated time taken to travel various distances (on the horizontal axis) in a typical urban environment [1].


Walking is the slowest mode of transport in terms of average speed (as indicated by the slope of its line), but for extremely short trips it is the fastest because there isn't any 'fixed' amount of time you have to spend getting ready, you just start walking. Cycling is the fastest mode for trips of a few kilometres despite having a lower moving speed than cars, because car users are thought to spend more time walking to and from their vehicles. Note, the average moving speed for cars in this chart is about 16km/h, which might seem very low, but that's because it's the average speed and takes into account congestion encountered in urban areas. Because bikes can filter through traffic jams cycling speed is much less affected by congestion and so is almost as quick as driving in this comparison.

This is a highly stylised comparison and you can obviously quibble with any of it, but for our purposes it makes two key points:
1. When thinking about transport speed people consider the total journey time rather than just the average moving speed.
2. On that basis, cycling may be the quickest mode for most short journeys in urban areas. Of course, if congestion is not an issue than the higher speed of cars will make it more attractive, while in extremely congested places cycling will look even better.

What about the monetary cost of travel? This is a bit more complicated, mainly due to the fixed costs involved in owning a car or bike (much less in the case of a bike). But if you set them aside and focus only only on per-trip costs, the important point for our purposes is that the cost of a bike trip is much lower than for any other mode except walking. Even if you take fixed costs into account it's likely that cycling still works out second cheapest for most people.

So if we stop at this point and consider only time and monetary costs, it looks like cycling should be an extremely attractive option for most short urban journeys. It's always cheap, and in congested traffic it's pretty quick. On this basis, cycling should be very popular in congested cities. So why isn't it?

Comfort and safety
Well, with some people it is. A growing number of Londoners, for example, choose cycling over other modes. But even in London cycling's mode share is low compared to its potential, and across the UK as a whole we still cycle very few short or medium-length trips compared to the Dutch or the Germans.

Transport economists have often acknowledged that people take other factors into account when choosing how to travel, with a key factor being the safety or comfort involved. Why 'comfort'? Because people tend to cite safety fears as a reason for not cycling, despite the 'objective' cycling casualty rates being very low even in London and the net health impact probably still positive. This suggests that it's not just the frequency of collisions that people are concerned about but also the frequency of near misses, and the generalised physical and mental discomfort of mixing with motor traffic.

Recently, some researchers have tried to understand how our own safety depends not just on our own choice of mode but also the choices of those around us. For example, in this article Anderson and Auffhammer provide evidence that people in the US are choosing bigger cars in part to protect themselves from the risks posed by everyone else's cars. The result is an 'arms race' in which the average US car becomes (a) bigger and (b) more dangerous to those around it.

Anderson and Auffhammer don't make this connection, but I think you can extend their model to cover cycling, treating bikes as basically extremely light vehicles that offer little or no protection in a collision.  Viewed that way, the choice to drive rather than cycle is similar to the decision to get a bigger car - for many people it is a deviation from their preferred option, motivated by fears over their own safety, that ultimately makes the roads less safe for everyone else too. Played out over a long enough period, it's easy to see how these individual decisions can cascade into a widespread rejection of cycling due to safety fears, as opposed to just the attractiveness of other modes or changing trip patterns.

However, this dynamic won't be the same everywhere. In places where most trips are short and the alternatives are very costly or slow, cycling may still be popular. That's why cycling rates tend to be highest in the centres of big cities - even though there's a lot of vehicle traffic it tends to be slow moving, which makes it less attractive as an alternative means of transport. The mixing of vehicles and bikes, however, means that cycling casualty rates may also be higher in these areas unless safer facilities for cyclists are specifically provided.

So to summarise, cycling has a cost advantage over other modes of transport (except walking, maybe) which is relatively fixed regardless of the conditions, but its relative benefits in terms of speed and safety/comfort are highly dependent on external conditions. Cycling will be quicker than other forms of road transport if traffic is congested, but unless traffic is so congested as to be stationary then the requirement to mix with heavy traffic will also make cycling less safe.

I think this helps make sense of trends such as the fall in cycling in Outer London and the simultaneous rise in Inner London. In Outer London the increasing availability and use of cars and their relatively high speed has cancelled out much of cycling's cost advantage and decreased its safety, while in Inner London high congestion and the falling number of cars has made cycling more attractive despite a still relatively high casualty rate.

Applications
One of the benefits of setting out the cycling decision in an economic framework is that it can allows us to estimate the effects of time, cost and comfort, and that in turn should enable us to make better decisions around infrastructure. Right now TfL are really struggling to properly analyse the costs and benefits of cycling infrastructure, apparently because their models don't incorporate any estimates of mode-switching in response to infrastructure changes, so cycling schemes look poor value for money in contexts where few people currently cycle, i.e. where such schemes may be most needed.

But if we can estimate a statistical model of mode choice with three factors (time, cost and comfort), then we can get at the question of how much additional cycling we should expect to see if we change the infrastructure on a particular route in a way that changes one or more of these factors simultaneously. Such a model could be expressed as something like the following:

Pij = axij + byij+ czij

where Pij is the probability of person i choosing to cycle trip j, x is time, y is cost, z is the comfort or cycling level of service, and a, b and c are the relevant elasticities of cycling with respect to each factor. This specification accounts for the fact that infrastructure elasticities will vary by person and by trip, although you could start with some averages.

Estimating this equation from observational data would be challenging, because every trip and every person are different and because simply gathering data on how people perceive safety is so difficult. So you would probably have to start by plugging in average parameter values from existing research about attitudes to generic types of infrastructure and road layout, assumptions about average speed, and so on.  

That way, you can start generating reasonable estimates of how many people might use a particular cycling facility in future, rather than just going on how many people currently cycle the same route. And that in turn means that you can get better estimates of the wider impacts of cycling, for example on how transport changes affect the 'market potential' of particular locations. This kind of analysis is already commonplace for vehicle and rail transport but not for cycling, due I think to a combination of the particular theoretical and empirical challenges posed by cycling and plain old cultural prejudice against what is still seen as an 'outsider' activity.

[1] Source: http://www.infrastructure.gov.au/infrastructure/mcu/urbanpolicy/files/ACTIVE_TRAVEL_DISCUSSION.pdf

Monday, 1 April 2013

Is housing scarcity bad for homeowners?

The other day I agreed with noted urban thinker EconomistHulk that we should build more homes by densifying existing urban areas where there is high demand, and also that this densification is frequently blocked by existing property owners for reasons of self-interest.

But Matt Yglesias (who has written an excellent short book on the housing problem) disagrees, arguing that housing scarcity is bad for homeowners, at least financially. The gist of his argument is that if you own a piece of land, then the ability to build more homes on that land is going to make you richer, even if the effect of supply on prices means the price per home is lower. Your neighbours might lose out because the increase in market supply makes their property cheaper, but that's their lookout.

As Matt notes, this begs the question of why we have so much NIMBYism in practice. He suggest it's partly because many people just don't understand how these things work, and partly because property owners attach a large use value to their property which can outweigh the exchange value, i.e. they want to live in the neighbourhood they chose rather than redevelop their land at higher density.

These are good points, but I think there's more to it. For one thing, density restrictions may serve several purposes, and in countries with highly decentralised political systems like the US where many services are funded by local property taxes one purpose is to minimise the level of fiscal 'free riding'. A rule stipulating maximum housing density effectively creates a floor price for housing and a minimum property tax contribution, ensuring that nobody can take advantage of local services without paying roughly the same entry price as everyone else. 'Fiscal zoning' of this kind is basically about keeping the poor out of your neighbourhood, but when key services like schools are locally funded there's a solid financial logic behind it which makes it very popular.

But even leaving these aspects of density restrictions aside, I don't think the home owner's decision is quite as straightforward as Matt suggests. He's right that land is a speculative asset, but as he says it's an unusual one in that home owners don't just own land but live on it too. And, very importantly, each property's value (in use or exchange) depends to a great extent on what does or doesn't happen on neighbouring properties.

The most important fact about urban development is that it creates various spill-over effects, and if you're a homeowner who doesn't plan on moving any time soon you're probably going to want to minimise the possibility of your neighbours redeveloping their property in a way that reduces the value of yours or makes it less enjoyable to live on through effects such as loss of light, traffic congestion and so on*. Rules against densification minimise the risk of this happening, and by buying into a neighbourhood with these rules home owners voluntarily accept a constraint on their own speculative activity in exchange for the knowledge that their neighbours are constrained too. Sure, when they're about to sell up they might be sorry that they can't just build a tower block on their plot of land, but the rest of the time they're probably grateful that nobody can.

To put it another way, Matt is correct that a property owner can increase that property's value by building as much housing on it as the market can bear, even if this extra density damages the value of neighbouring property. But the problem is that your neighbours can do exactly the same thing to you. And if everyone goes hell for leather in redeveloping their own land then you can end up with lower average land values and a less pleasant area than you would if everyone voluntarily agreed to constrain their redeveloping impulses**.

However, the average value of each housing unit would also be considerably lower, so from the point of view of a social planner interested in making housing more affordable this may still be a good deal, especially if you don't think the environmental or amenity costs of density outweigh the benefits. And in many cases there will be an intermediate range where increasing average densities does increase land values. But given the risks involved, the logic of the argument above is that if local planning / zoning rules are basically set by home owners acting in their own self interest then we shouldn't be surprised to see widespread NIMBYism.

* Matt mentions such 'non-pecuniary' factors but doesn't seem to accord them much importance.

** There's a proof of the potential negative impact on land values in DiPasquale and Wheaton's urban economics textbook, which is unfortunately out of print.

Friday, 29 March 2013

Hulkonomics and the housing crisis

A variety of voices have spoken out recently about the UK's housing crisis, none more distinguished than @EconomistHulk, who addressed the issue on Twitter this morning:

I fully agree with Hulk's analysis, which goes to the heart of the housing crisis, not to mention the wider issues of macroeconomic volatility, wealth inequality and social mobility. The fundamental problem, I think, is that today's housing market is characterised by a spatial coincidence of elastic demand and inelastic supply. In other words, the places where we most need to build homes are often the places where people are least inclined to allow it.

It wasn't always this way. Elastic demand for housing means that as incomes grow at a certain rate housing demand grows even faster, but in decades gone by much of this demand could be met by expanding cities outward. This urban expansion and deconcentration was facilitated by huge improvements in the speed, cost and availability of transport technologies, from the tram to the train to the bike to the car.

But in the past couple of decades urban deconcentration in many of the richer parts of the world has slowed or gone into reverse, partly because we've stopped coming up with amazing new transport technologies and partly because shifts in economic geography mean that jobs have returned to city centres. In London, for example, population and incomes are growing faster in Inner London than in the suburbs, after almost two centuries of deconcentration.

This is a big problem for housing supply, because it is much easier to build in places where nobody lives than to redevelop existing areas at higher densities. But as Hulk says above, that's exactly what we need to do if we are going to meet housing demand.

One of the reasons it is so hard to redevelop existing residential areas is that we have allowed the existing property owners to effectively veto new development which they feel is not in their interests. And they use this veto a lot. Not uncoincidentally, this happens to enrich them if they are home owners. Hulk again:
Overall, restricting new housing supply in existing residential areas of high demand is bad for the economy (because it puts a brake on jobs growth and agglommeration effects), bad for the environment (because it forces people to make longer commutes), bad for social mobility (because it limits access to housing to those whose parents owned property in valuable areas) and bad for equality (because it exacerbates wealth inequality). But it's good for wealthy homeowners, so you can see the dilemma. 

In future posts I'll look at whether and how we can moderate over-consumption of housing demand by the rich and improve housing supply. But for now, make sure you follow the Hulk.

Friday, 22 March 2013

Cycling fatality rate about five times as high in London as in Berlin

The other day Danny from Cyclists in the City linked to the city of Berlin's new plan for improving cycling conditions. I haven't been to Berlin for years and don't know what it's like to cycle there, but on the face of it the strategy looks pretty good.

What the strategy documents also allow us to do is compare how dangerous cycling in Berlin is to cycling in London, using the fatality rate per kilometre cycled. Berlin's strategy says (in German) there are 1.5 million cycling trips  a day, at an average of 3.7 km a trip, giving a total of just over 2 billion km cycled per year. And in the last three years there were 26 recorded cycling fatalities or 8.7 per year, giving an annual rate of 0.43 fatalities every 100 million km (or to put it the other way, over 230 million km cycled for each one fatality).

We can get comparable figures for London from the annual Travel in London report and road casualties reports. According to the data on trips per day (table 3.5) and average distance per trip (figure 2.5) in the most recent Travel in London report, there were 0.5 million cycling trips a day in London over the last three years, at an average distance of 3.1 km per day, giving a total of 553 million km cycled per year in London. There were also 39 cyclist fatalities in this period or an average of 13 per year, giving an annual rate of 2.35 fatalities every 100 million km (or just over 40 million km cycled for each fatality).

So it looks like the fatality rate for cycling in London is about five times as high as in Berlin. Note, these figures shouldn't be subject to the same concerns over casualty recording as the serious injury rates I calculated before, as fatalities are much less subject to under-recording than injuries.

Here's a table with all the numbers:

LondonBerlin
2009201020112009-112008-10
Trips per day (millions)0.470.490.500.491.50
Distance per trip (km)2.993.313.043.113.70
Total distance per year (m km)5125915555532,026
Fatalities in period1310163926
Fatalities per year131016138.7
Annual fatalities per 100m km2.541.692.882.350.43
Million km per fatality39593543234

Thursday, 21 March 2013

How first time buyers have lost out to home owners and what we could do about it

The Chancellor yesterday announced that the government would set up a mortgage guarantee scheme to make it easier to buy a house. Unlike previous schemes this will be open to those who already own a home as well as first time buyers, and there'll be a consultation on the details before the scheme launches in early 2014.

The extra subsidy for purchases by those who already own a home is interesting, since as a group they already seem fairly well served by the existing mortgage market - and they have massively expanded their share of that market over the last twenty years. The chart below, based on data from the Council of Mortgage Lenders, shows the trend in the share (by value rather than number of loans) of mortgages for 'home purchase' (i.e. excluding buy to let) between 1993 and 2012. 'Home movers', i.e. those who already own a home, accounted for 52% of the market in 1993 and 66% in 2012 (though note there was a change in how the data was collected in 2005).

Trend in home mover and first time buyer shares (by value) of UK mortgage lending (dashed lines indicate change in methodology in 2005)
When talking about 'squeezed-out' first time buyers the rise of buy to let gets all the attention, too much so I think, but going by the numbers the expanding market share of home movers may be a bigger issue.

So why has lending to home movers expanded so much? A new academic paper by Professor Geoff Meen, one of the country's leading authorities on housing markets, offers a partial explanation. He argues that
existing owners benefit particularly at a time of rising prices, because they are able to use the accumulated equity in their current properties to relax the constraints on their budgets and can, consequently, trade up-market or purchase additional properties. These further demands for housing will put upward pressure on prices and will be accompanied by added demands for mortgage debt by existing owners. Since new households do not have these advantages, the share of mortgage debt which they obtain falls and they also suffer from the rise in prices.
So basically, home owners benefited disproportionately from the long house price boom of the 1990s and 2000s because they used the increased equity in their homes to put down a bigger deposit, increasing their buying power by enabling them to get bigger and better (in terms of interest rates) mortgages. This increased demand then fed back into house prices and the process continued, in what Meen calls a financial 'accelerator' effect. What's more, some home owners didn't sink their increased wealth into a new home for themselves but instead bought one or more additional homes - so this dynamic also can also help explain the rise of buy to let, not as some unrelated external factor but as the natural result of the hugely unequal accumulation of home equity.

First time buyers, meanwhile, got hit by both rising prices and a shrinking share of the mortgage market. The average time spent waiting to buy went up and the home ownership rate went down. When First time buyers got much of the blame when the market crashed, but Meen argues that "the rise in the debt stock was mainly a consequence of the actions of existing owners", with most first time buyers simply caught up in the consequences. With a crushing irony, the hike in deposit requirements that followed the crash hit first time buyers much harder than home owners.

There's one upside for first time buyers: during an economic downturn prices usually fall faster than incomes (because housing demand is 'income elastic', i.e. demand changes by more than the change in income), and the fall in prices disproportionately reduces the buying power of home owners while bringing some prices within the reach of first time buyers. So in a downturn the accelerator becomes a decelerator and the first time buyer market share can increase, as long as they aren't too crushed by high deposit requirements. And indeed, we do see some signs of first time buyers reclaiming market share in the last few years in the chart above.

It's a simple enough theory, but it seems to explain a lot of important features of the UK's housing market in the last decade or so, from the boom and bust cycle to the falling home ownership rate to the increased proportion of cash sales from all the accumulated equity still sloshing around the system.

But as the accelerator/decelerator dynamic seems rather built in to how UK mortgage markets work, the question of what we can do about it is a tricky one. As noted above, traditional controls on loan to value rates don't really help since they don't constrain home owners with significant accumulated equity. Instead, Meen suggests two things:

  • First, we should increase the housing supply on a widespread and long-term enough basis that it outpaces rising demand from population and income growth, preventing house prices from rising too much and unearned wealth accruing to home owners.
  • But for periods when prices do rise we should look into 'fiscal measures' to reduce the effect of those rising prices on rising demand - measures such as the property tax proposed by John Muellbauer in 2005. This tax would be a constant percentage of each home's value and would rise or fall in line with house prices, so that higher prices wouldn't be a free lunch for home owners.
Both of these seem like they could be quite effective, but given they would primarily hit the home owners who have done so well out of the last boom and who are so good at getting their voices heard in politics, it seems unlikely we'll see them any time soon.

Monday, 18 March 2013

Giving people what they say they want mightn't give them what they want

There's a school of thought which says that since people generally say they want big houses with gardens then that's what we should be building and not small flats in city centre locations. This is intuitively appealing, but the problem is that housing is a composite good: when people buy a home they're not just buying the structure but the location too, and in practice they're willing to trade off one for the other.

The huge price differentials between structurally very similar properties in different parts of the country indicate that people attach a great deal of value to location, and the small flats you see in high-density areas are in large part the result of people willingly sacrificing dwelling space for locational benefits, even if in an ideal world they would much prefer to live in a big house in a garden in the same location.

Making it easier to build more flats in high-density areas makes it easier to find acceptable trade-offs and would be good for people who value central locations, and it would also be good for people who want to live in the suburbs since there will be less displaced demand from the centre. You sometimes see city centre locations trying to restrict the supply of flats and justifying it on the grounds that people say they want to live in houses, but this doesn't get rid of the uneven pattern of locational demand - it just means that high demand in some areas is concentrated on a smaller number of properties so prices go (sorry) through the roof. Trying to give everyone what they say they want (a big house in a low-density area) makes it harder to give people what their behaviour shows they really want (a home that provides some optimum mix of a range of characteristics including structure and location).

There's an analogous situation in transport policy, in that if you asked people what they would like in an ideal world most of them would probably prefer a nice fast drive in their own car from A to B. But the spatially uneven pattern of transport demand means that trying to satisfy this just leads to huge levels of congestion on certain roads. Since what people really want is just a reasonably quick and cheap way to get from A to B, a better policy is to provide public transport on high-demand routes that moves more people without causing (much) congestion.

The lesson is that it's better to understand the aggregate impact of people's choices and learn from the trade-offs that we make, rather than just try to satisfy what we say we would like in an ideal world. Hardly anyone loves buses in their own right, but they do love the ability to get where they want to go. Similarly, most people don't dream of living in a high-density flat but providing these kinds of homes is a vital part of enabling people to live where they want and ensuring that cities stay as affordable as possible.

By the way, none of this is to say that we shouldn't make it easier to build suburban housing too. We should - but the point is that unless supply is increased in response to demand in city centres too then you won't fix the affordability problem.

Saturday, 9 March 2013

The awful truth about buy to let lending

Faisal Islam, Channel 4's excellent economics editor, tweeted this morning
Judging by the number of retweets, this struck a chord with a lot of people, which is not surprising. Since hardly anybody is a buy to let (BTL) landlord but lots of people are suffering from high housing costs, the idea that BTL landlords are gobbling up all the extra mortgage lending and pushing everyone else out is very attractive.

But it's also wrong. The truth is, while lending to BTL increased by £2.6 billion between 2011 and 2012, lending to first time buyers also went up a lot, by £3.7 billion to be exact. So Faisal could just as easily have said that "ALL the increase in mortgage lending over 2012 was to first time buyers", though I imagine this wouldn't have had quite the same impact.

To explain, let's go the sources which Faisal helpfully tweeted:

There are two issues here, one of which is the a relatively minor problem of comparing CML data on BTL lending with Bank of England data on total lending. But the more important point is that BTL is just one component of gross mortgage lending, alongside lending to home buyers (first time buyers and home movers) and remortgaging. It's perfectly possible for lending to both BTL and home buyers to have risen by more than the total increase in mortgage lending, as long as lending for remortgaging falls. And that's exactly what happened in 2012.

The table below shows mortgage lending in 2011 and 2012 by category of buyer, based on CML's press releases on mainstream mortgage lending and BTL. Lending to first time buyers went up £3.7bn, to home movers £1.9bn and to BTL £2.3bn, but because remortgaging fell by £5.9bn the total only went up £2.3bn.

Value in £ millions of new mortgage lending in 2011 and 2012, by category
Re-mortgage  First time buyers Home movers Buy to let All home lending
2011 46,700 23,600 51,700 13,800 135,800
2012 40,800 27,300 53,600 16,400 138,100
% change -12.6% 15.7% 3.7% 18.8% 1.7%
£m change -5,900 3,700 1,900 2,600 2,300

Here's the same information in chart form, which I think puts the supposedly terrifying rise of buy to let into some perspective.


Saying that BTL accounted for all of the increase in mortgage lending is just as much of a fallacy as that tabloid trope of claiming that all the new jobs have gone to foreigners. Both of them are misleading, but they are also hard to kill off because they seem to identify a handy scapegoat for a more systemic problem.

Wednesday, 6 March 2013

The problem with 'transport poverty'

The RAC Foundation have been getting some good press coverage with their argument that we should be very concerned about the 'transport poverty' experienced by low-income households who own cars. Their preferred solution is a big cut in fuel duty, as merely "tinkering" with the rate would be akin to "rearranging the deck chairs on the Titanic" according to their chair Stephen Glaister.

The RACF's argument is based on these statistics from the ONS, showing that there are around 800,000 households in the UK who are in the poorest 10% of households according to disposable income and who own a car, and that these households spend an average of £45 a week on transport, including an average of £16 a week on motor fuel. As these households all have a weekly income of less than £168 (see the top row of the table) that means that many of them are spending more than a quarter of their income on transport. The RACF calls this 'transport poverty' and thinks the way to deal with it is to make fuel cheaper.

There are several problems with this argument. First, what the RACF don't tell you is that only 31% of households in the poorest tenth of the income distribution actually own a car, compared to 96% in the richest tenth (see p.9 here). So if 'transport poverty' due to fuel costs is a problem, it is a problem only for a minority of the poor.

Second, it is likely that many of those the RACF say are in transport poverty aren't really that poor after all. Households with very low reported incomes are often there because they have suffered a temporary drop in incomes, but they could still be otherwise reasonably well off. As these academics point out,
for some of those at the very bottom of the income distribution, a recorded very low income should not be taken as a sign of more general lack of resources... It might reflect the fact that some individuals experience very low income for a relatively short period of time, but that they maintain their spending at some sort of long-run level: for example, someone between jobs (who could have a 0 or very low income if measured over a sufficiently short period), or someone making a loss in their selfemployment business (which would count as a negative income).
So it is very likely that many of the low-income households who own cars are only temporarily low-income. But even if we accept that these households really are poor in the usual sense and that enough of them own cars for this to be an issue (no matter how contradictory those two statements might seem), there is a third big problem with the RAC Foundation's argument. The ONS figures they cite indicate that car-owning households in the poorest 10% spend around £13m a week on fuel (830,000 households with an average weekly spend of £16), compared to spending on fuel by all households with cars of around £640m a week (19.7 million households with an average weekly spend of £32.50).

That means the households in 'transport poverty' account for just two per cent of total motor fuel spending in the UK. By contrast, car-owning households in the top 10%, who all have disposable household incomes of over £57,000 a year, account for 21% of total motor fuel spending. So any cut in fuel tax aimed at reducing 'transport poverty' would overwhelmingly benefit the better off.

Cutting fuel duty would be an extremely bad way to reduce poverty, especially if the money has to come from elsewhere. If cuts in fuel duty were paid for reducing benefits then you would be directly transferring money from poor to rich. If the RAC Foundation are really interested in reducing 'transport poverty' then they would be better off arguing for reductions in the cost of transport modes used mostly by the poor (i.e. the bus). But the best and most tried-and-tested way to reduce poverty of any kind is to just give poor people more money.

Monday, 4 March 2013

Mapping cyclist casualty concentrations in London

I've produced some maps of London cycling casualties on this blog before but it's hard to come up with an image that manages to capture both the scale and the spatial specificity of the issue. It matters where cycling casualties happen and it also matters how many there are in a particular area, but at the London-wide level there are so many that the most straightforward visualisation techniques just aren't adequate, even before you start trying to understand the underlying patterns of exposure and causation.

Here, for example, is a simple map showing one dot for every recorded cycling casualty in London over the five years to 2011 (the most recent year available). It includes fatal, serious and slight casualties, with the latter category by far the largest.
This map does tell us some useful things: cycling casualties are heavily concentrated in central London, and judging by the linear patterns seem to be common on major roads too. But there are so many casualties in the centre that the image becomes overwhelmed and you lose a sense of either scale or space. Some kind of aggregation would help.

Following the steps outlined on the Mapbox blog here, I generated a 'heatmap' of cycling casualties in Quantum GIS. A heatmap is a technique that uses spatial interpolation to predict the number of events (in this case, cycling casualties) in a small part of an area based on the actual number observed in or close to that area. It smooths out the pattern a bit and highlights with variations of colour the locations with the greatest concentrations.

If anything, this shows even more clearly how many casualties there are on London's major roads (including many of the ancient Roman routes shown recently on the Mapping London blog). I thought it could do with a bit more clarity, so, again following the Mapbox tutorial, I added some definition using contour lines, and a legend.  Note that the heatmap model 'predicts' 140 casualties in the deepest red cells and zero in the deep blue squares that cover most of the suburbs.


Maybe the contours look a bit messy at the London-wide scale but when you zoom into the city centre I think they help, partly by overcoming the blockiness of the heatmap results. In the map below I've labelled the areas in central London with the greatest concentrations of cycling casualties in the last five years. As you can see, the Elephant and Castle area is pretty clearly the worst in terms of the number of casualties, while there is a cluster of areas just north of the river also focused on major junctions.


Finally, here's a version with the street network showing underneath.

Tuesday, 19 February 2013

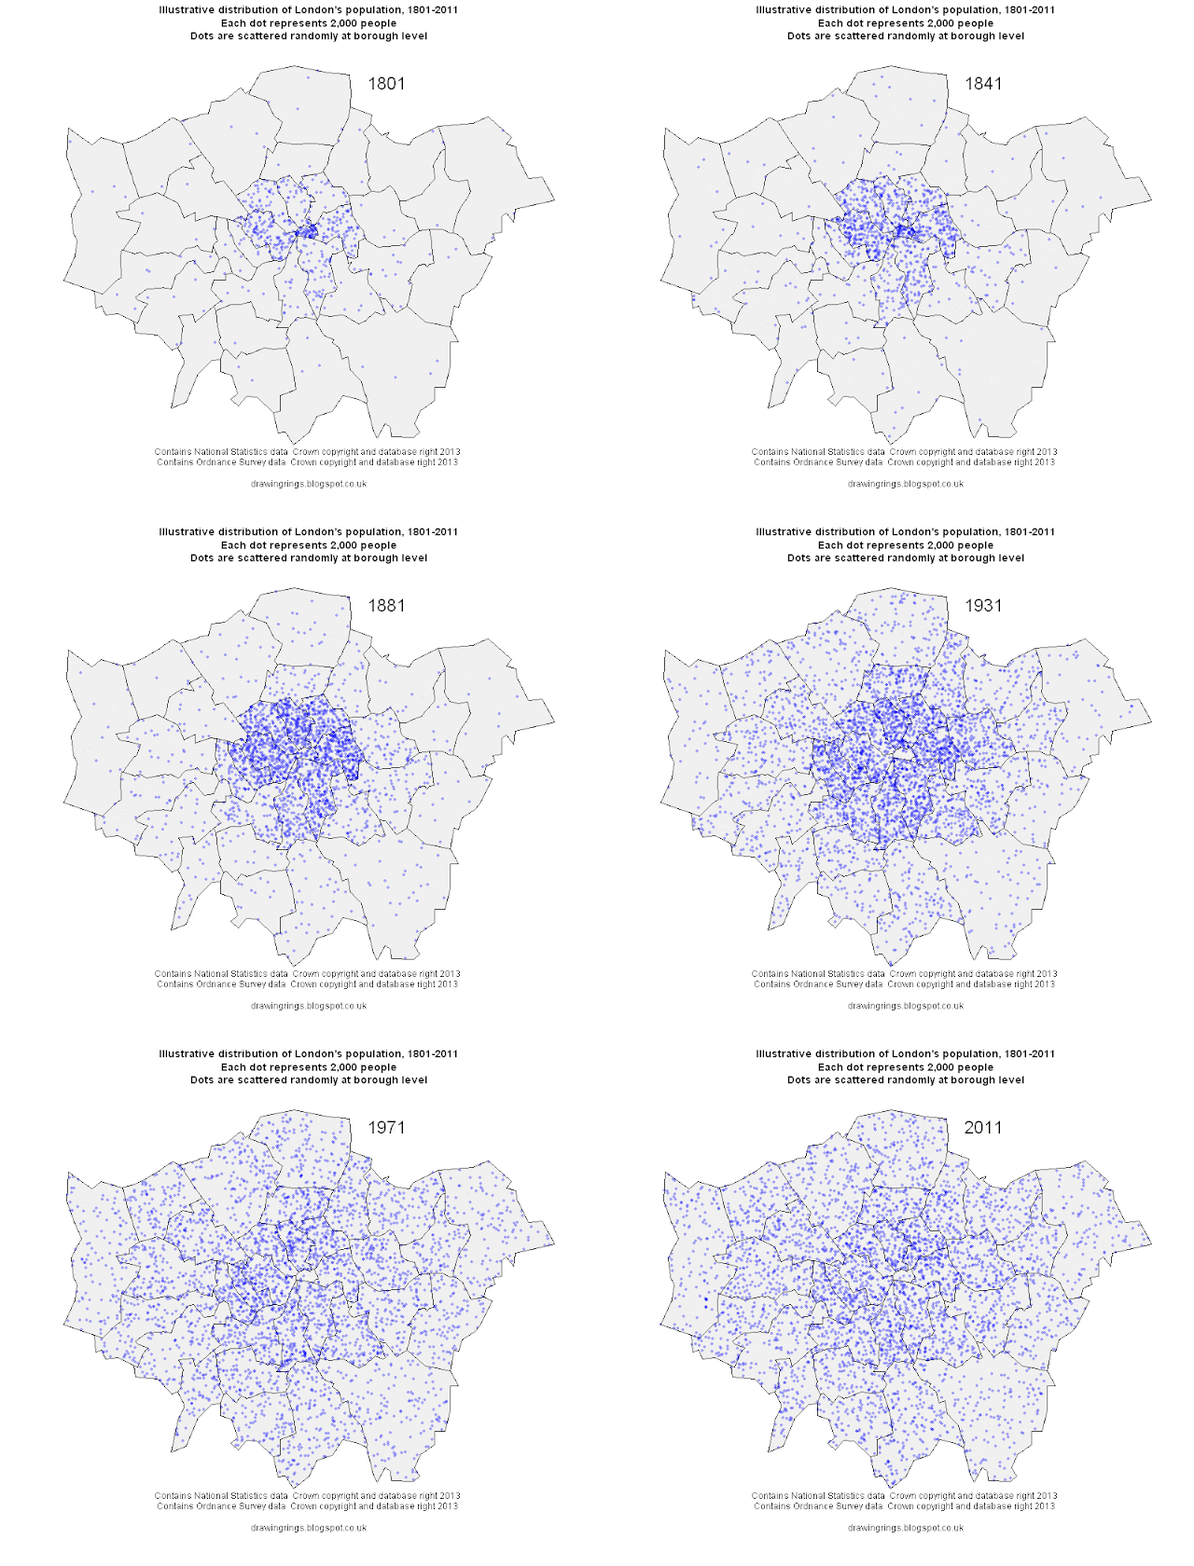
Animating London's population change 1801-2011

Over the last couple of hundred years London's population has grown and spread out on a vast scale. This process has involved a remarkable deconcentration of population from the centre to the suburbs: in 1801 the vast majority of its million people were crammed into a few central boroughs, with the square mile of the City of London holding 129,000 people. The population of the city grew by more than 5 million over the next century with the vast majority of that growth in the inner suburbs opened up by public transport. Over the course of the 20th century suburbanisation accelerated with the advent of the car, only for population growth to pick up again in the centre in the last few decades.

Summing up all this change in a single graphic is quite a challenge, so instead I've made this simple animated map, illustrating the changes in population using a dot-density approach where every dot represents 2,000 people. The dots are randomly distributed at borough level at the point of each Census starting in 1801 and ending in 2011, so they are not meant to represent the exact locations of individual settlements.


The maps were made in R using data from the Census (downloaded from the London Datastore and updated with 2011 data) and boundaries from the Ordnance Survey. The animation was done in UnFREEz as I couldn't get the native animation in R to work.